Architecting the Future of Web3.
Driven by the specialized expertise of Nodes Design, we empower the next wave of Web3 creators by turning complex tokenomics into a seamless, minutes-long design experience.
Client name
Tokenomics
About
Tokenomics is a specialized platform designed to democratize blockchain asset creation. Facing the challenge of traditional technical barriers, they partnered with Node to transform complex smart contract deployment into an "effortless" digital journey.
Our team engineered a high-fidelity suite of tools that distills intricate protocols into a clear, step-by-step interface. The result is a professional ecosystem where creators can move from vision to on-chain launch in mere minutes.
Client profile
Indonesia
Country
Medium (15-20 Employees)
Company size
Crypto & Web3
Industry
Project Output
UI UX Design
Landing Page Design
Dashboard Development
Mobile Development
Showcase Design & Design Systems
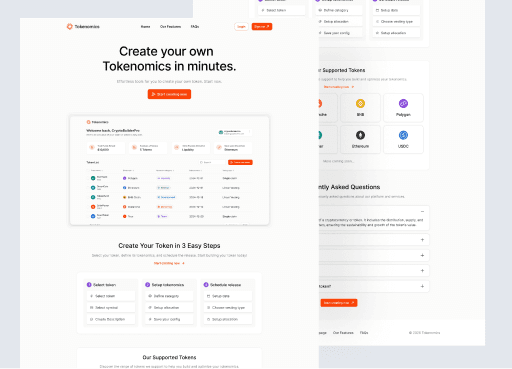
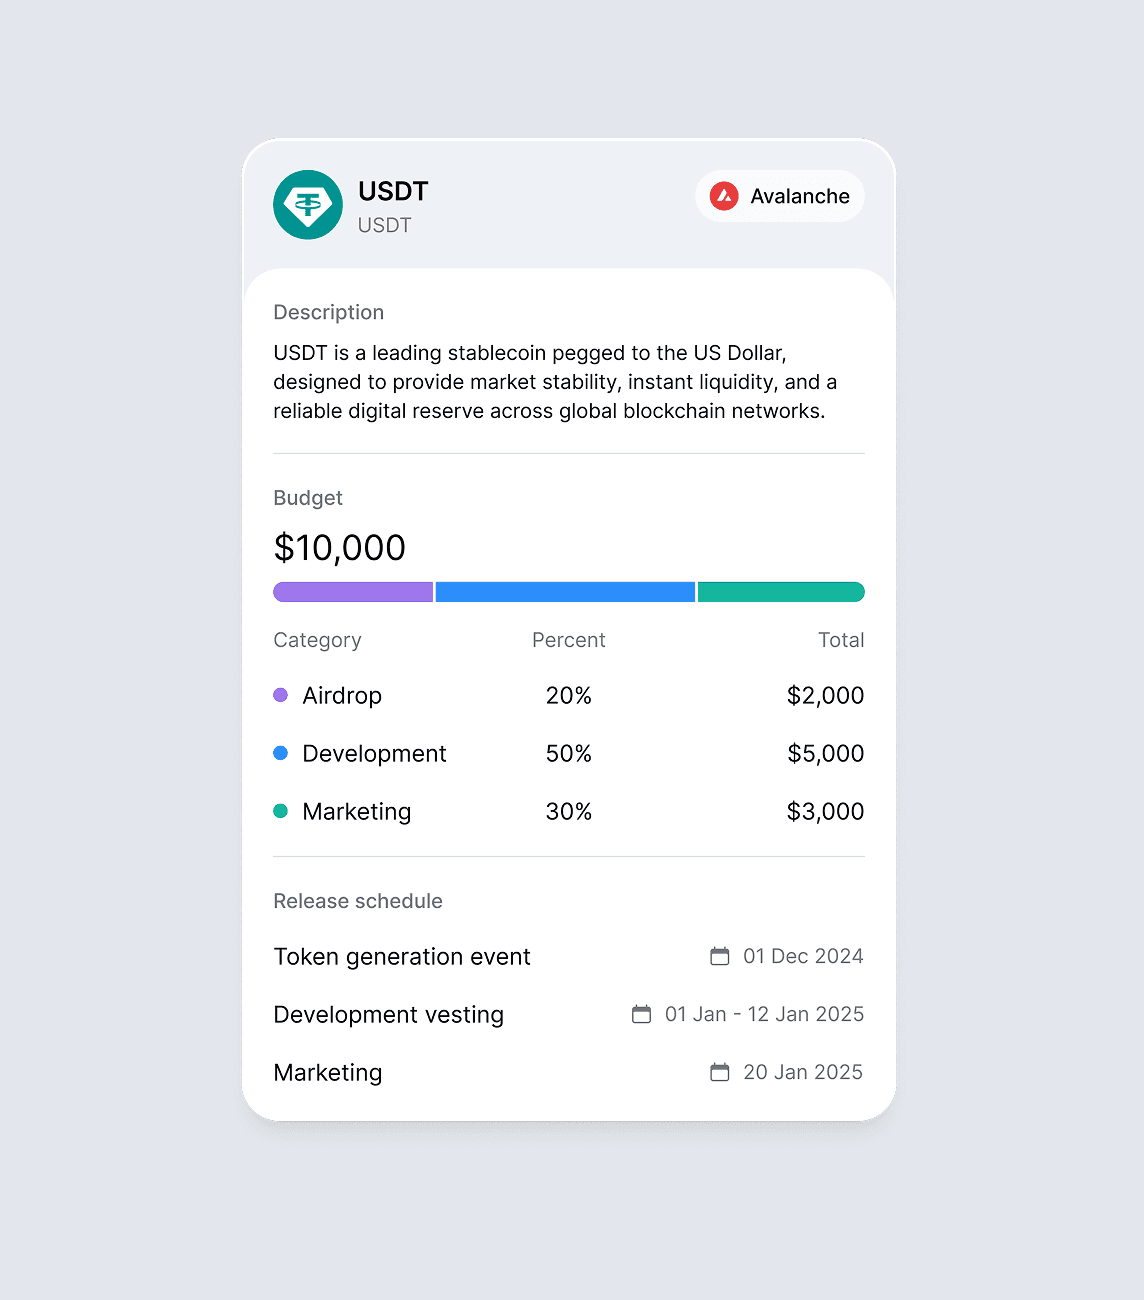
We engineered a comprehensive design system to ensure every stage of digital asset creation feels intuitive and professional. From mapping complex user logic to visualizing real-time market performance, every UI element is crafted with a focus on information clarity and seamless navigation.
By integrating high-fidelity components and structured user flows, we transformed intricate blockchain processes into a series of clean, step-by-step interfaces. The result is a consistent design ecosystem where creators can navigate through research, application, and launch phases while monitoring critical data—all within a single, unified dashboard.
From user flows to real-time data, every element was designed with one goal: effortless navigation.
Product Structure
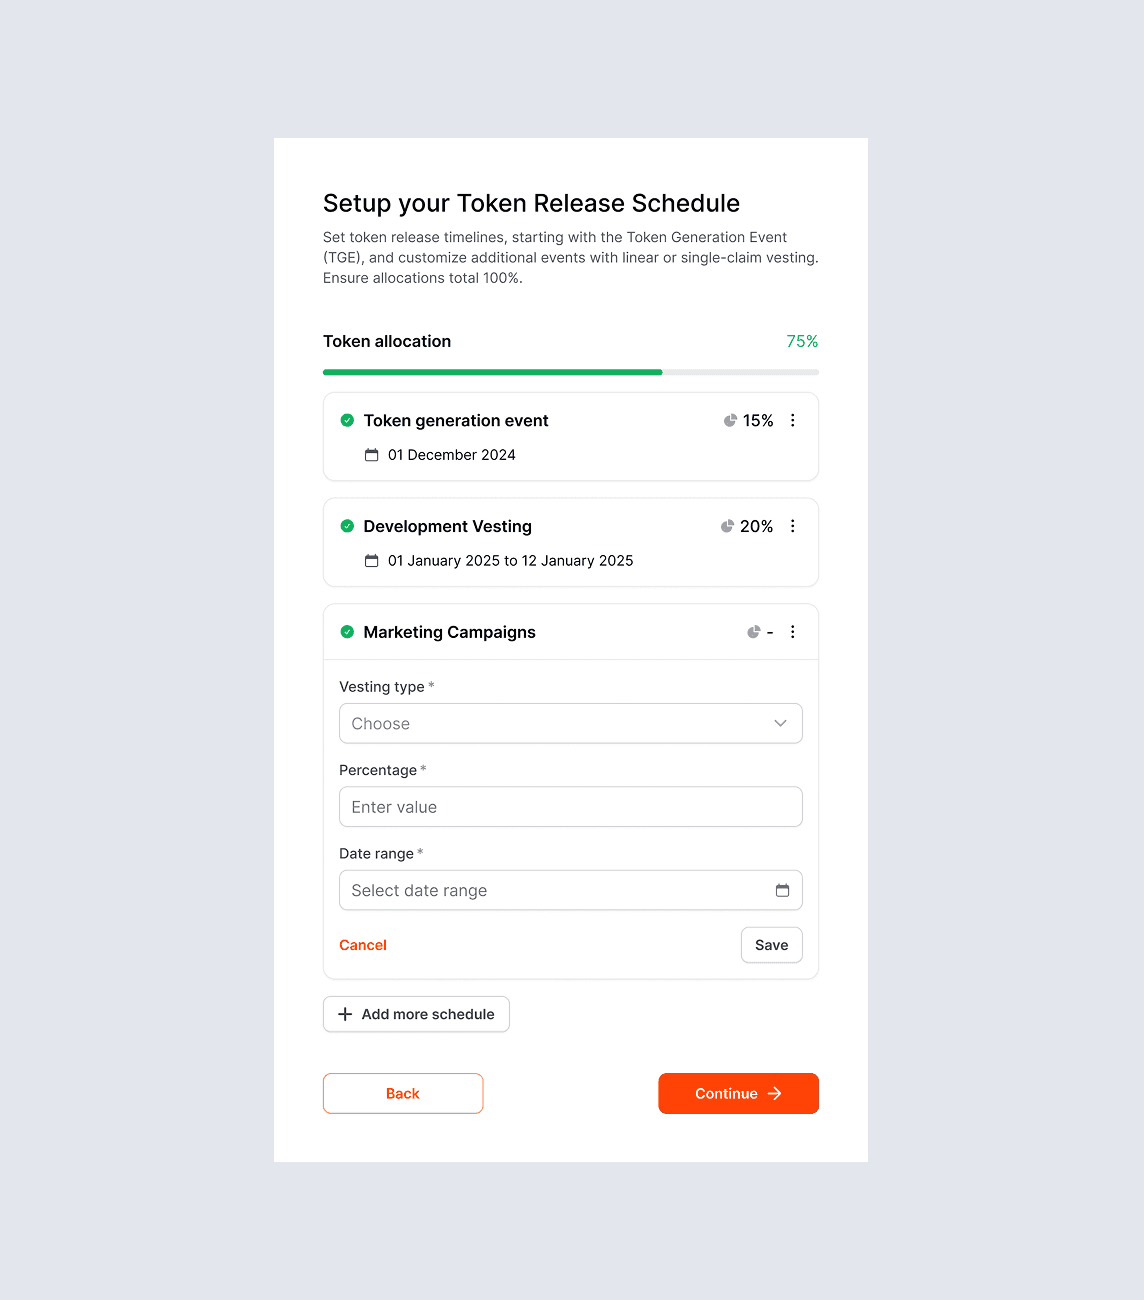
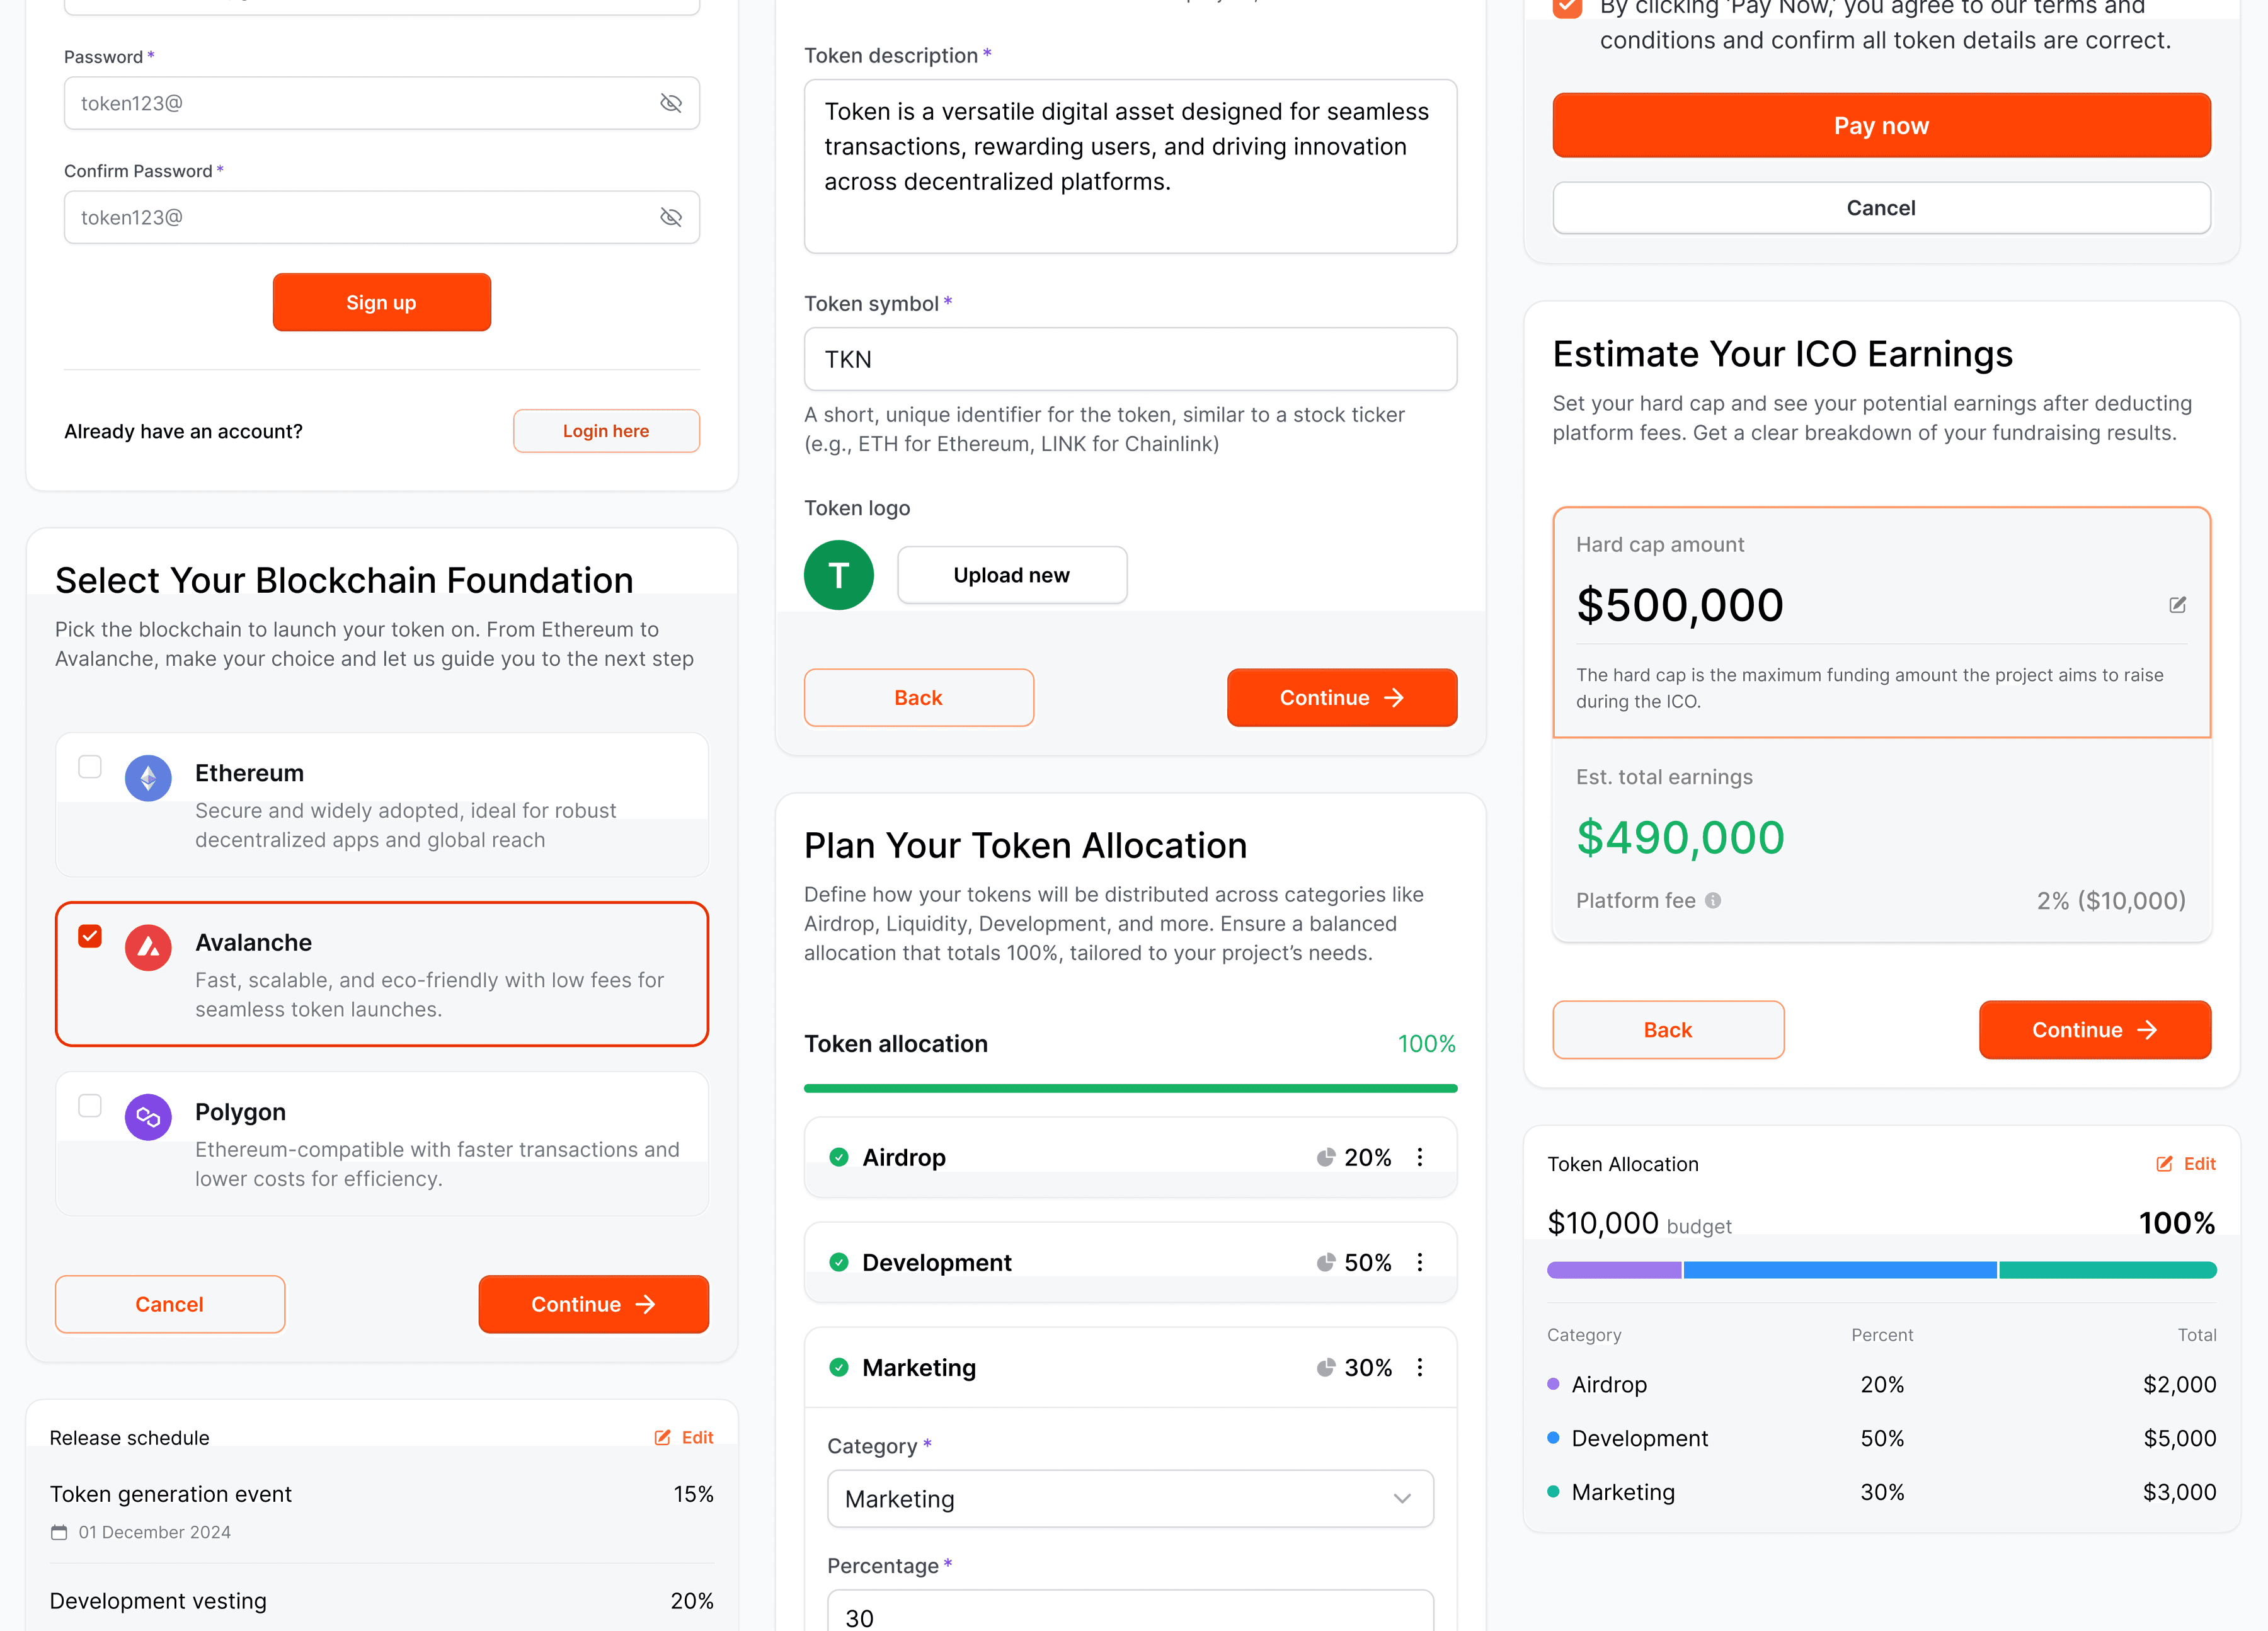
We built a cohesive product architecture that bridges complex backend logic with an intuitive frontend experience. By mapping out the entire system through detailed flowcharts, we ensured that every user decision point is accounted for, creating a seamless path from the initial login to final execution.
Our approach integrates user journey mapping with real-time data visualization. We visualize the user experience as a continuous flow—from research and application to full completion—while providing clear, actionable feedback through dynamic performance metrics. This structure allows users to navigate intricate processes with ease, supported by a visual language that turns abstract data into clear, understandable insights.

